Every coffee shop has its stars—the menu items that customers crave and consistently order. These "workhorse" items are the backbone of your business, driving a significant portion of your revenue. Recognizing and optimizing these offerings can enhance profitability and streamline operations. This chapter explores four practical methods to identify your top-performing items, combining data analysis, customer insights, and profitability metrics.
Most cafés have a few items that quietly carry the weight of the business. They may not be flashy or seasonal, but they sell consistently, day after day. These are your workhorse items, and the most reliable way to find them is through your POS data.
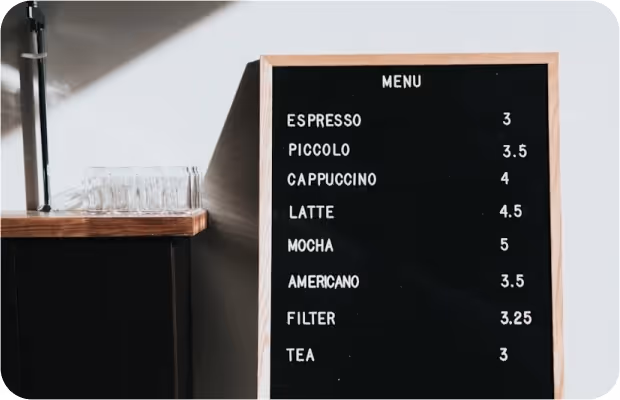
In the Square dashboard, start by checking your item sales report. Look at both total sales and quantity sold. You might find that your iced vanilla latte brings in the most revenue, while your plain drip coffee moves the highest volume. Both are valuable, but in different ways. The high-volume items help with predictability and batching, while the high-revenue items help your margins. It’s also worth breaking this data down by time of day and day of week. Cold brew might spike during the afternoon rush. Avocado toast may only be available on weekends. If you’re preparing the same menu for Tuesday morning and Saturday brunch, you’re probably overcommitting somewhere and missing an opportunity somewhere else.
Even a simple weekly habit of reviewing your sales data can help you make better choices—what to promote, what to cut, and what deserves a permanent spot on your counter.

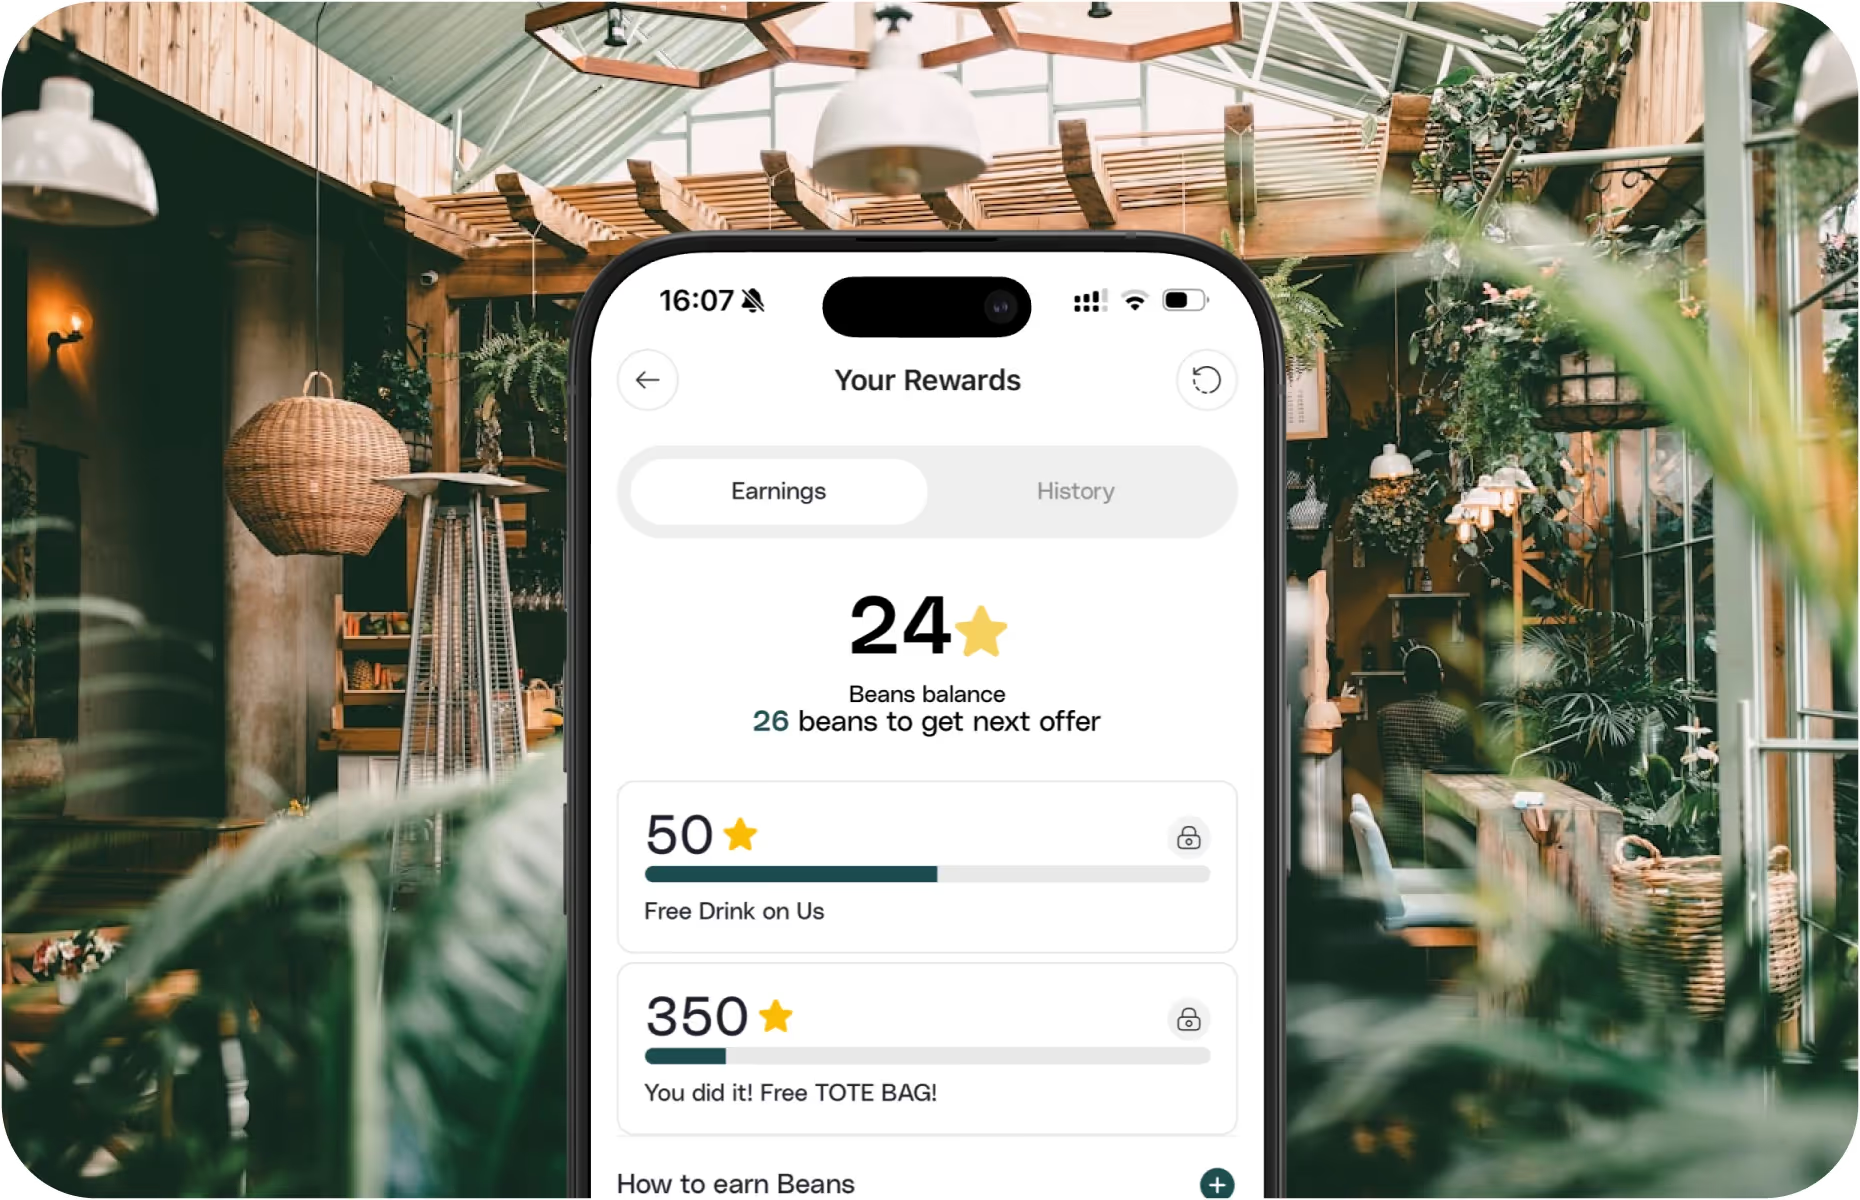
Raw sales data can tell you what’s moving. But to understand why, and how to sell more of it, you need to know who's buying and how they behave. Apps like Per Diem give you a way to connect the dots between your top items and your top customers. It integrates with Square and shows you which customers come back most often, what they tend to order, and when. That insight helps you go beyond “top seller” and see what actually drives loyalty.
For example, maybe five of your best regulars always order a cappuccino with a chocolate croissant around 9 a.m. That’s a chance to create a combo offer or pre-pack that pairing for speed. Or you might see that your highest-spending customers mostly drink alternative milks, so featuring more plant-based drinks could align with the people who already spend the most in your shop. You don’t need to track individual behavior manually. When your POS is synced with a tool like Per Diem, you can start seeing clear trends—what combinations repeat, what times are busiest for your best customers, and which items are linked to higher return visits.
Beyond digital tools, direct customer feedback remains a powerful resource. Engaging with patrons, whether through casual conversations, comment cards, or online surveys, can reveal preferences and perceptions that data alone might miss.
For example, customers might express a desire for more non-dairy options or suggest variations to existing menu items. Such feedback can guide menu adjustments, ensuring offerings align with customer desires. Additionally, hosting tasting events or introducing limited-time specials can serve dual purposes: gauging interest in new items and making customers feel valued and involved in your business's evolution.

Understanding the profitability of each menu item is crucial. Calculating the gross profit margin helps identify which items contribute most to your bottom line.
If a latte costs $1.50 to make (COGS) and is sold for $5.00:
A higher gross profit margin indicates a more profitable item. By calculating this for each menu item, you can focus on promoting high-margin products and reconsider or adjust those with lower margins. By combining sales data analysis, customer insights, direct feedback, and profitability calculations, you can effectively identify and optimize your coffee shop's workhorse items, leading to increased efficiency and profitability.
Discover how smart mobile strategies help coffee shops drive repeat purchases, higher ticket sizes, and better product visibility.
→ Watch: 12 Mobile App Strategies Coffee Shops Are Using to Boost Average Order Value


.svg)