

















The Restaurant Retention Ledger 2026

An analysis of more than 600,000 anonymized restaurant customers reveals how first orders become repeat habits and lasting revenue.
Restaurants can explain revenue changes with remarkable precision. They know how many orders arrived, which products sold, when demand peaked, and how much the average customer spent.
What is often less visible is how that revenue develops across a customer relationship.
A first order can look valuable while leading nowhere. A smaller order can belong to a customer who returns every week. Two customers spending the same amount today may be moving in completely different directions.
The Restaurant Retention Ledger examines anonymized ordering activity across Per Diem-powered restaurant brands to understand that movement. Rather than treating every transaction as an isolated sale, it follows how customer value changes from the first order onward.
The findings reveal a restaurant economy shaped by three forces: how quickly customers return, how their ordering behavior changes with frequency, and how strongly revenue concentrates among the customers who keep coming back.
Four findings stand out:
- Among customers who returned, the median time between their first and second orders was 14 days.
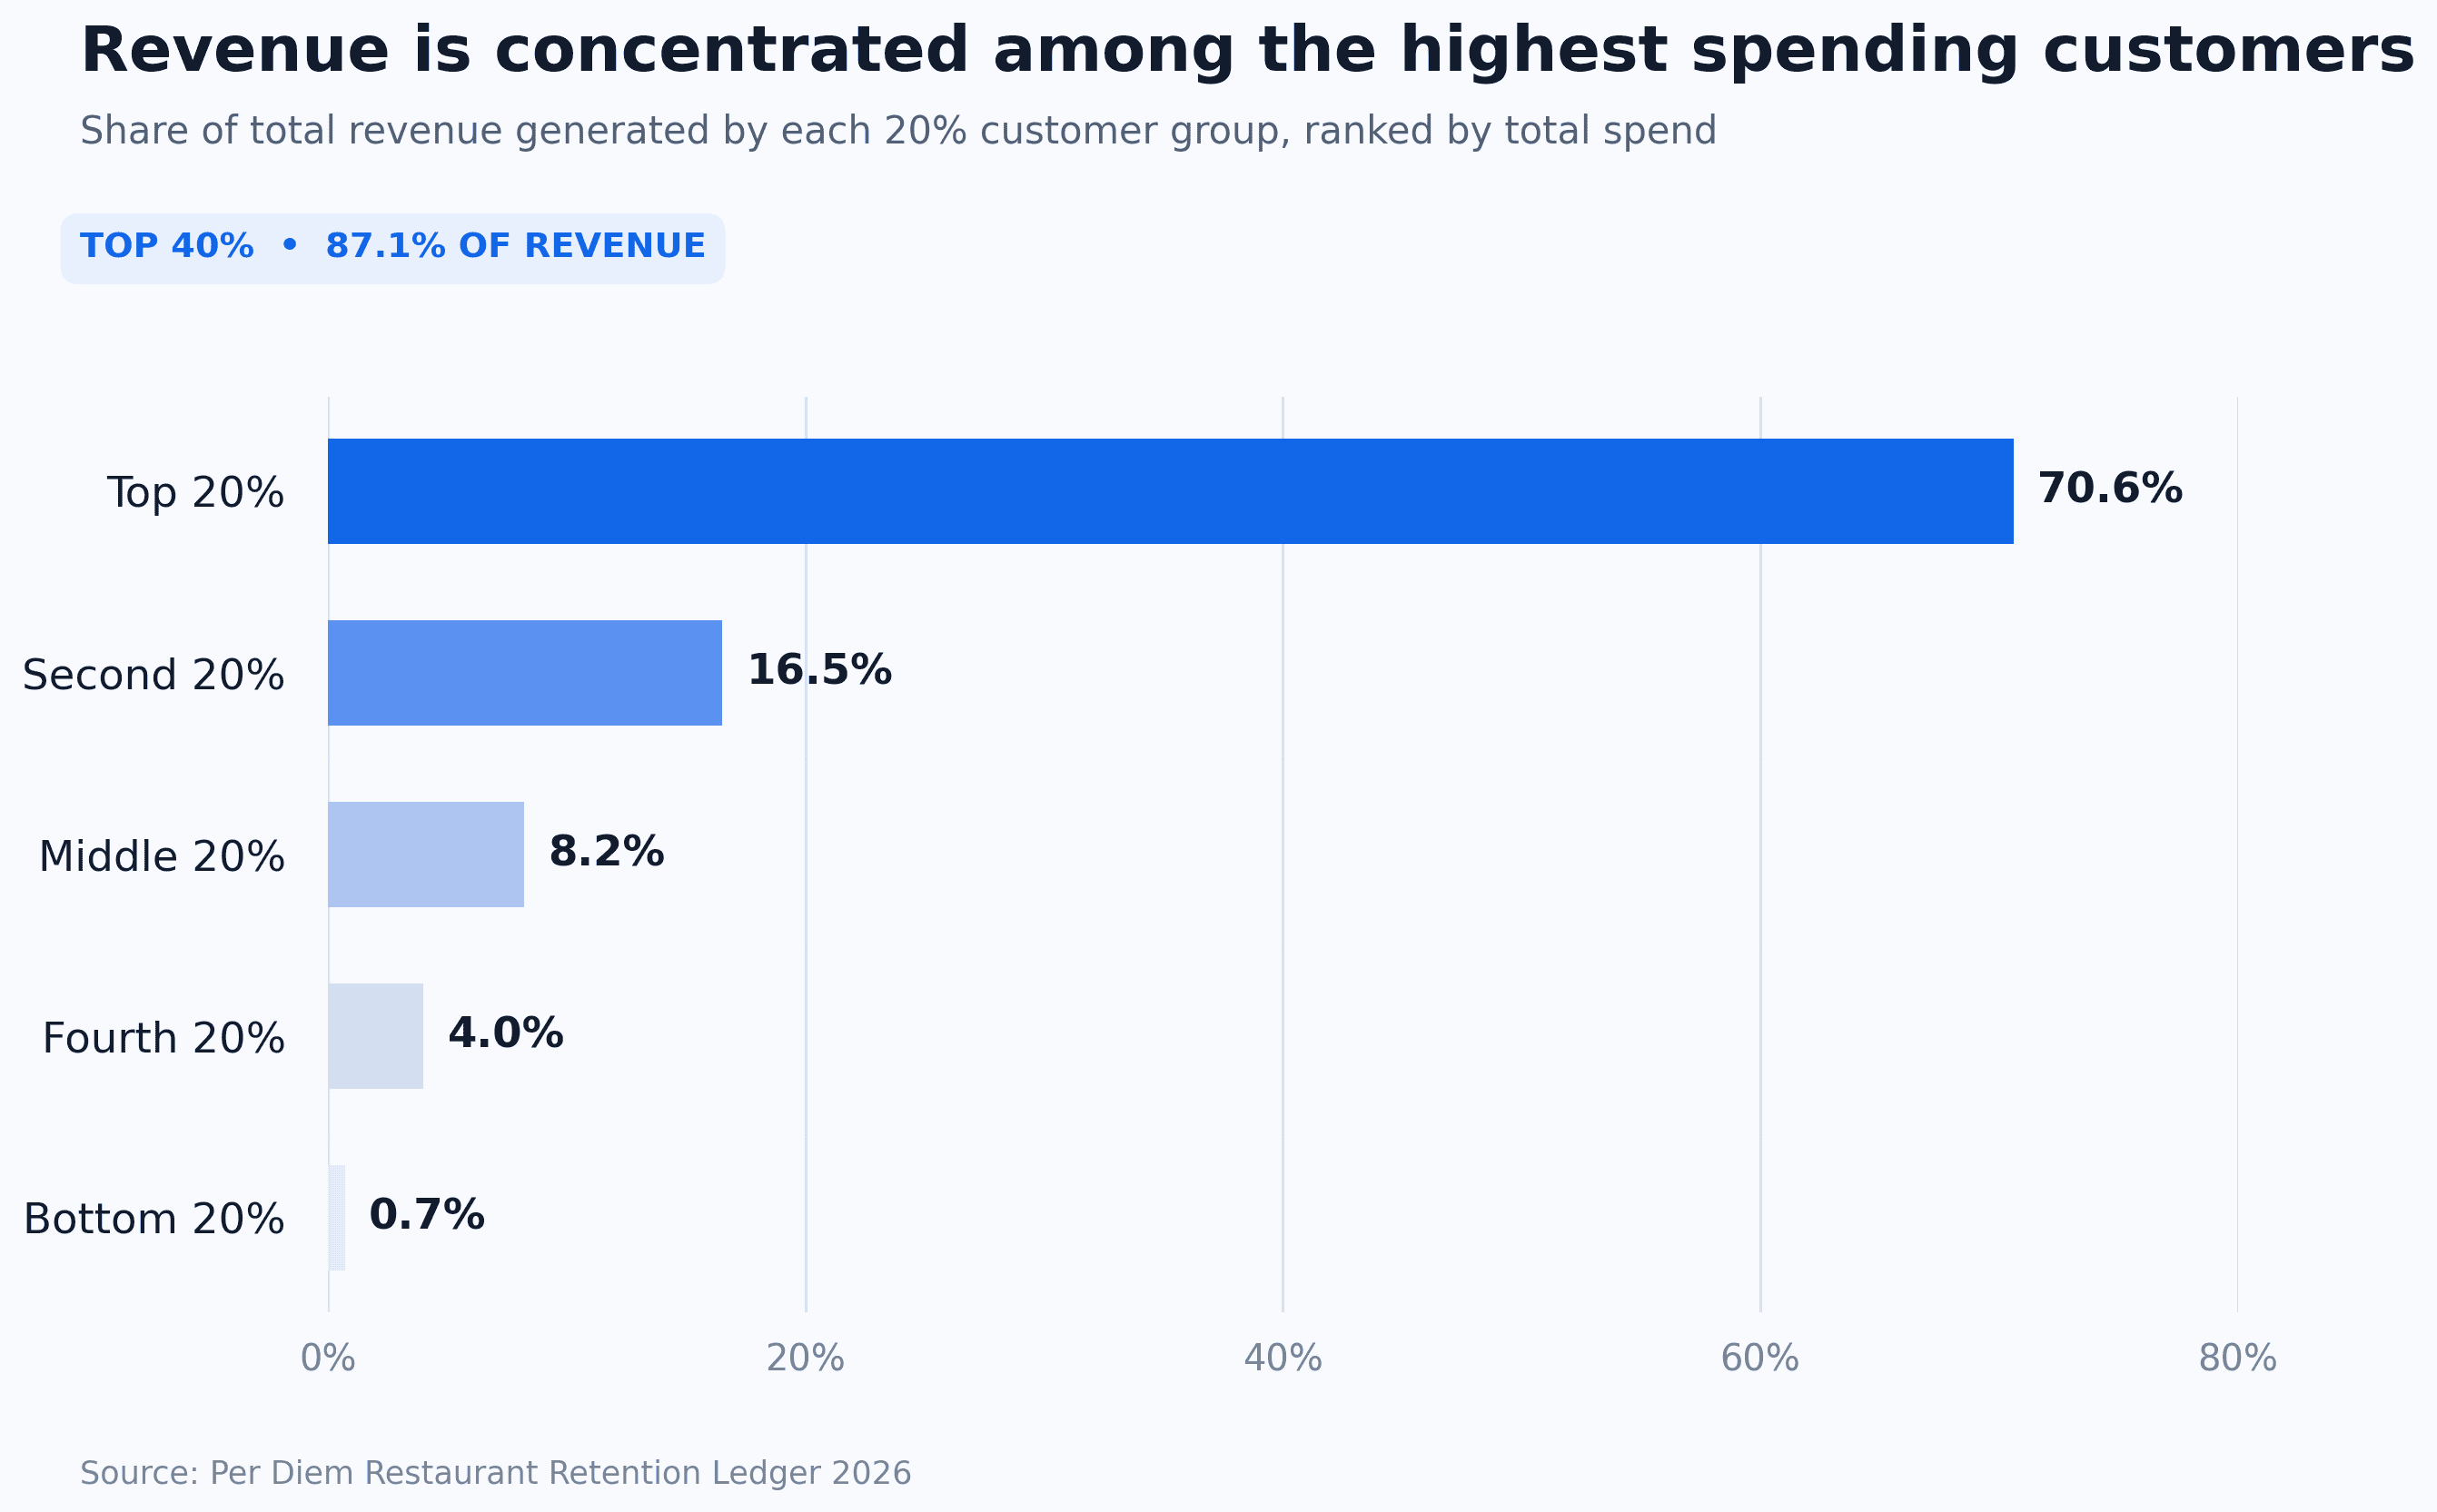
- The top 20 percent of customers generated 70.6 percent of revenue.
- The top 40 percent generated 87.1 percent of revenue.
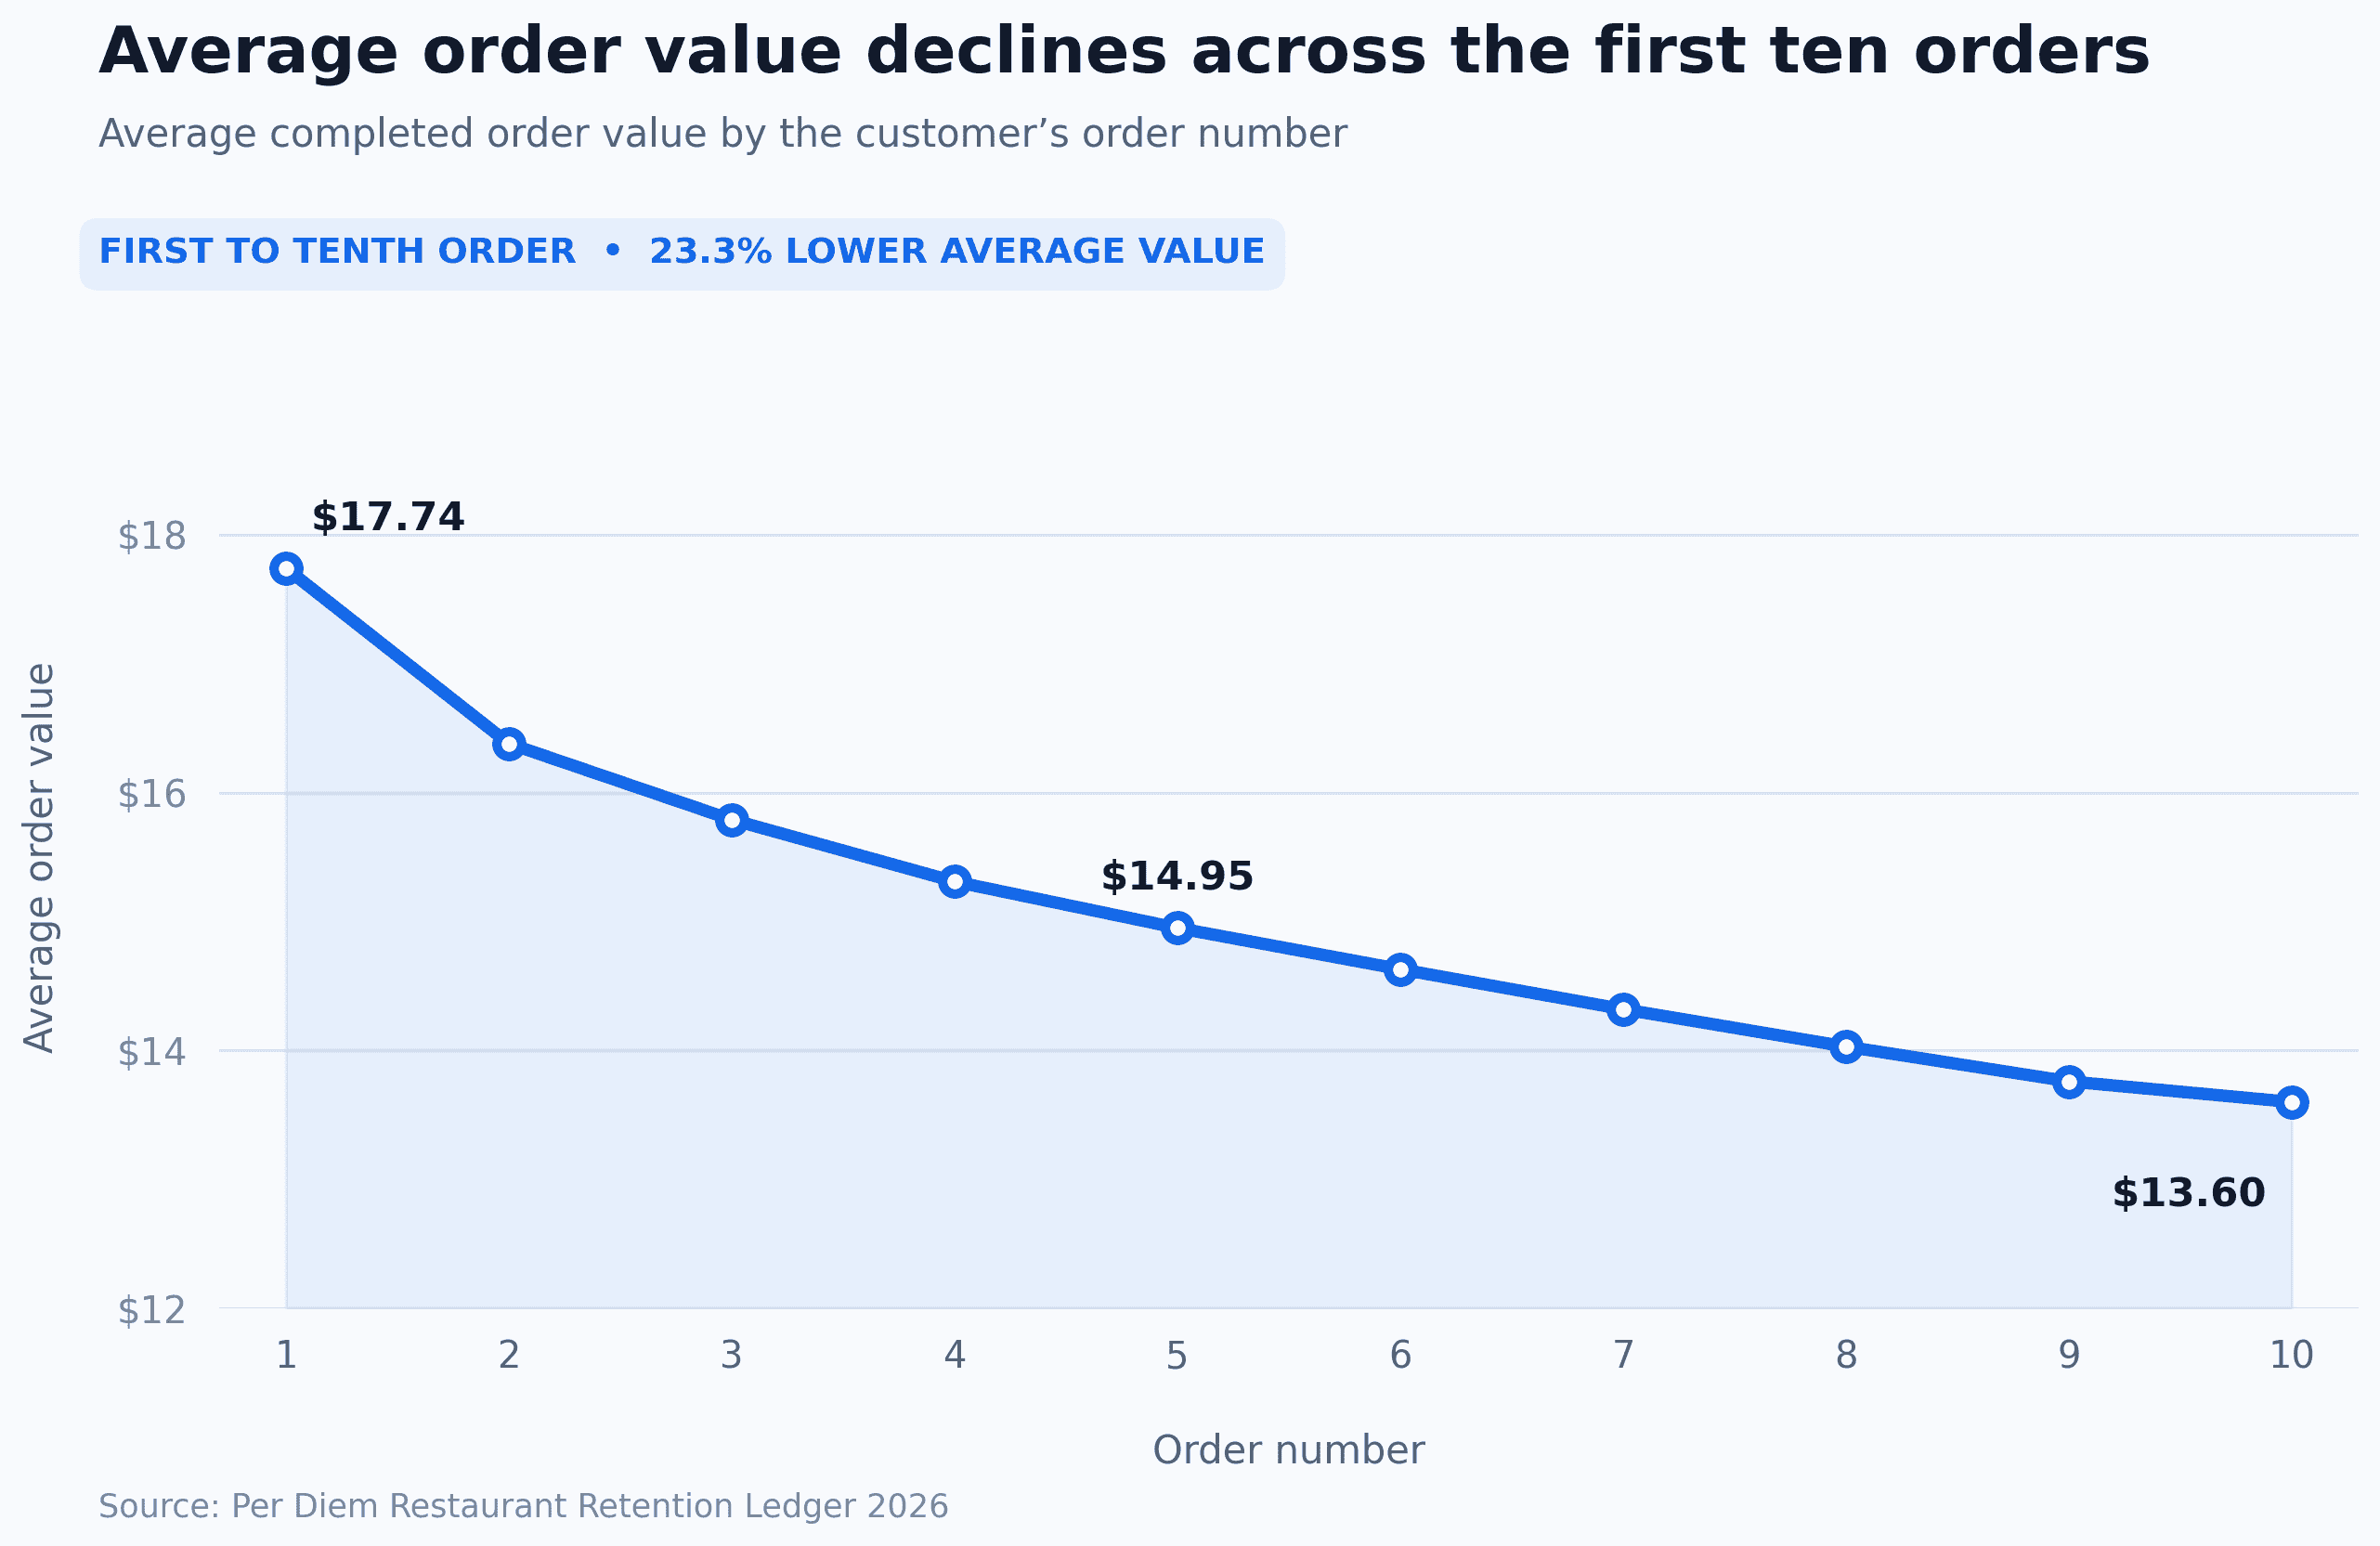
- Average order value declined from $17.74 on the first order to $13.60 on the tenth, a decrease of 23.3 percent.
Together, these findings complicate a familiar idea about restaurant loyalty. The most valuable customers are not necessarily the people placing the largest individual orders. They are the customers whose first transaction develops into a pattern.
The second order has a clock
The first order proves that a restaurant can win someone’s attention. The second offers something more meaningful: evidence that the experience was worth repeating.
Among customers in the analysis who placed a second order, one-quarter returned within five days. Half returned within 14 days, while three-quarters had returned within approximately 40 days.
The average time to the second order was 32.8 days, considerably longer than the 14-day median. That difference matters. It suggests that a smaller group of customers took much longer to return, pulling the average upward, while the typical returning customer moved more quickly.
For restaurant leaders, this changes how the period after a first order should be understood. The first few weeks are not an empty waiting period before a customer can be classified as retained or lost. They are when a large share of repeat relationships begin taking shape.
A customer who orders again within five days is behaving differently from someone who returns after five weeks. Both have placed two orders, but the pace of the relationship is different. One may already be forming a routine. The other may still be an occasional customer.
Traditional reporting can flatten these differences into the same repeat customer total. A retention ledger preserves the timing, because timing helps reveal whether a relationship is accelerating, developing slowly, or failing to progress.
The practical question is therefore not only whether customers return.
It is how long a restaurant waits before giving them another relevant reason to.
The basket gets smaller. The relationship gets bigger.
The ordering data reveals another apparent contradiction.
Average order value was highest on the first order, at $17.74. It fell to $16.38 on the second order, $15.79 on the third, and continued declining gradually until reaching $13.60 by the tenth order.
From the first order to the tenth, average order value decreased by 23.3 percent.
Viewed in isolation, that decline could appear negative. Viewed across the customer relationship, it reveals something more useful: frequent customers do not need to spend more every time to become more valuable.
A first order may include several products while someone explores the menu, orders for another person, or reaches a promotional threshold. As customers become familiar with the restaurant, their orders may become more routine and more focused. This is a plausible interpretation, not something the current data alone can prove.
What the data does show is that basket size and customer value are not interchangeable.
A customer placing a $13.60 order repeatedly can contribute far more revenue than someone who places one $17.74 order and never returns. The smaller basket is not necessarily evidence of a weakening relationship. It may be the economic signature of a habit.
Revenue pools at the top
If order frequency explains how customer value develops, revenue concentration shows where that development ultimately leads.
Customers in the analysis were divided into five equal groups according to their total spending. The highest spending 20 percent generated 70.6 percent of all revenue.
The next 20 percent generated another 16.5 percent. Together, the top 40 percent of customers accounted for 87.1 percent of revenue.
The remaining three groups contributed considerably less:
- The middle 20 percent generated 8.2 percent
- The next 20 percent generated 4 percent
- The lowest 20 percent generated 0.7 percent
This concentration is striking, but it should not be interpreted as an argument for focusing exclusively on customers who are already valuable.
Every customer in the highest spending group began somewhere else. Before becoming part of the top 20 percent, they placed a first order, made an early decision to return, and continued ordering often enough for their cumulative value to grow.
By the time a customer appears in the highest spending group, much of the important movement has already happened.
That is why the 14 day median matters alongside the 70.6 percent revenue share. One figure shows where revenue eventually concentrates. The other shows how quickly the customer relationships behind that revenue can begin developing.
The opportunity is not merely to reward the customers who have reached the top. It is to recognize which newer customers are beginning to move in that direction and which established customers are no longer progressing as expected.
Retention should be measured as movement
Most restaurant dashboards report retention as a percentage. That percentage can be useful, but it compresses several different customer stories into one number.
A customer placing a second order after five days is different from one returning after five weeks. A regular whose basket becomes smaller may still be growing in total value. A customer can place several orders and then quietly stop. Another can begin slowly and later become one of the restaurant’s most valuable guests.
A useful retention ledger should therefore track movement across the relationship:
- How many first time customers place another order
- How long the second order takes
- How customers progress through successive orders
- How order value changes as frequency increases
- Where revenue becomes concentrated
- When an established ordering pattern begins to weaken
This perspective also changes how restaurant marketing should be evaluated.
A welcome campaign should be judged by whether it helps create a first order. Communication after that first purchase should be judged by whether it contributes to another visit within the period when repeat behavior is most likely to form. Efforts aimed at established customers should protect continued frequency rather than relying only on larger baskets.
The objective is not to send more messages. It is to understand what stage the customer has reached and respond in a way that helps the relationship progress.
What restaurant leaders can take from the ledger
Three conclusions emerge from the analysis.
First, the period immediately following the first order deserves greater attention. Among customers who returned, half placed their second order within 14 days. Waiting several months to evaluate or influence retention can mean missing the period when repeat behavior is already taking shape.
Second, average order value does not tell the complete story of customer quality. Order value declined across successive purchases, yet revenue remained heavily concentrated among the highest spending customers. Frequency can create substantial cumulative value even when later baskets are smaller.
Third, the most valuable customer group is an outcome, not a starting segment. Restaurants can identify their top customers today, but sustainable retention depends on understanding how new customers reach that group and how existing high-value customers remain there.
These findings point toward a more precise way to manage restaurant growth. Acquisition creates the first transaction. Retention determines how much of that initial demand develops into lasting revenue.
The ledger begins after the sale
A first order records what a customer bought. It does not reveal what the relationship will become.
That begins to emerge through what happens next: whether the customer returns, how quickly they return, how often they continue ordering, and how their cumulative value changes over time.
The Restaurant Retention Ledger shows that these movements are economically significant. Half of returning customers place their second order within 14 days. Average baskets become smaller across successive orders, yet a relatively small share of customers ultimately produces most of the revenue.
The clearest conclusion is that customer value cannot be understood from a single transaction.
Restaurants need customer intelligence to see the progression behind the revenue: the first order that becomes a second, the second that becomes a routine, and the routine that eventually becomes a meaningful share of the business.
Retention is not one number at the end of a reporting period. It is the continuous movement of customers from one level of value to the next.
About the research
The Restaurant Retention Ledger is based on anonymized completed orders associated with registered customer IDs across Per Diem-powered restaurant brands.
Time to second order was calculated among customers who placed at least two orders. Customer revenue groups were created by ranking customers according to total spending and dividing them into five equal groups. Average order value was measured across the first ten completed orders associated with each customer.
About Per Diem
Per Diem gives restaurants using Square a connected platform for direct ordering, loyalty, customer intelligence, and automated lifecycle marketing. By connecting customer behavior with timely communication, Per Diem helps restaurants understand how relationships are developing and act before valuable customers are lost.
Book a demo to see how Per Diem helps restaurant brands turn customer activity into lasting relationships.