
























Getting Started with the Per Diem Customer CRM
The Customer CRM gives you a complete view of everyone who orders from your store: who they are, how often they order, who's at risk of churning, and who's ready to become a regular. It combines a full customer directory with AI-powered analytics so you can act on your customer data, not just look at it.
- Log in to your Dashboard.
- In the left sidebar, click Customers.
- You'll land on the Customers page, which has two tabs at the top: All customers and Insights.
Still require support?
Contact support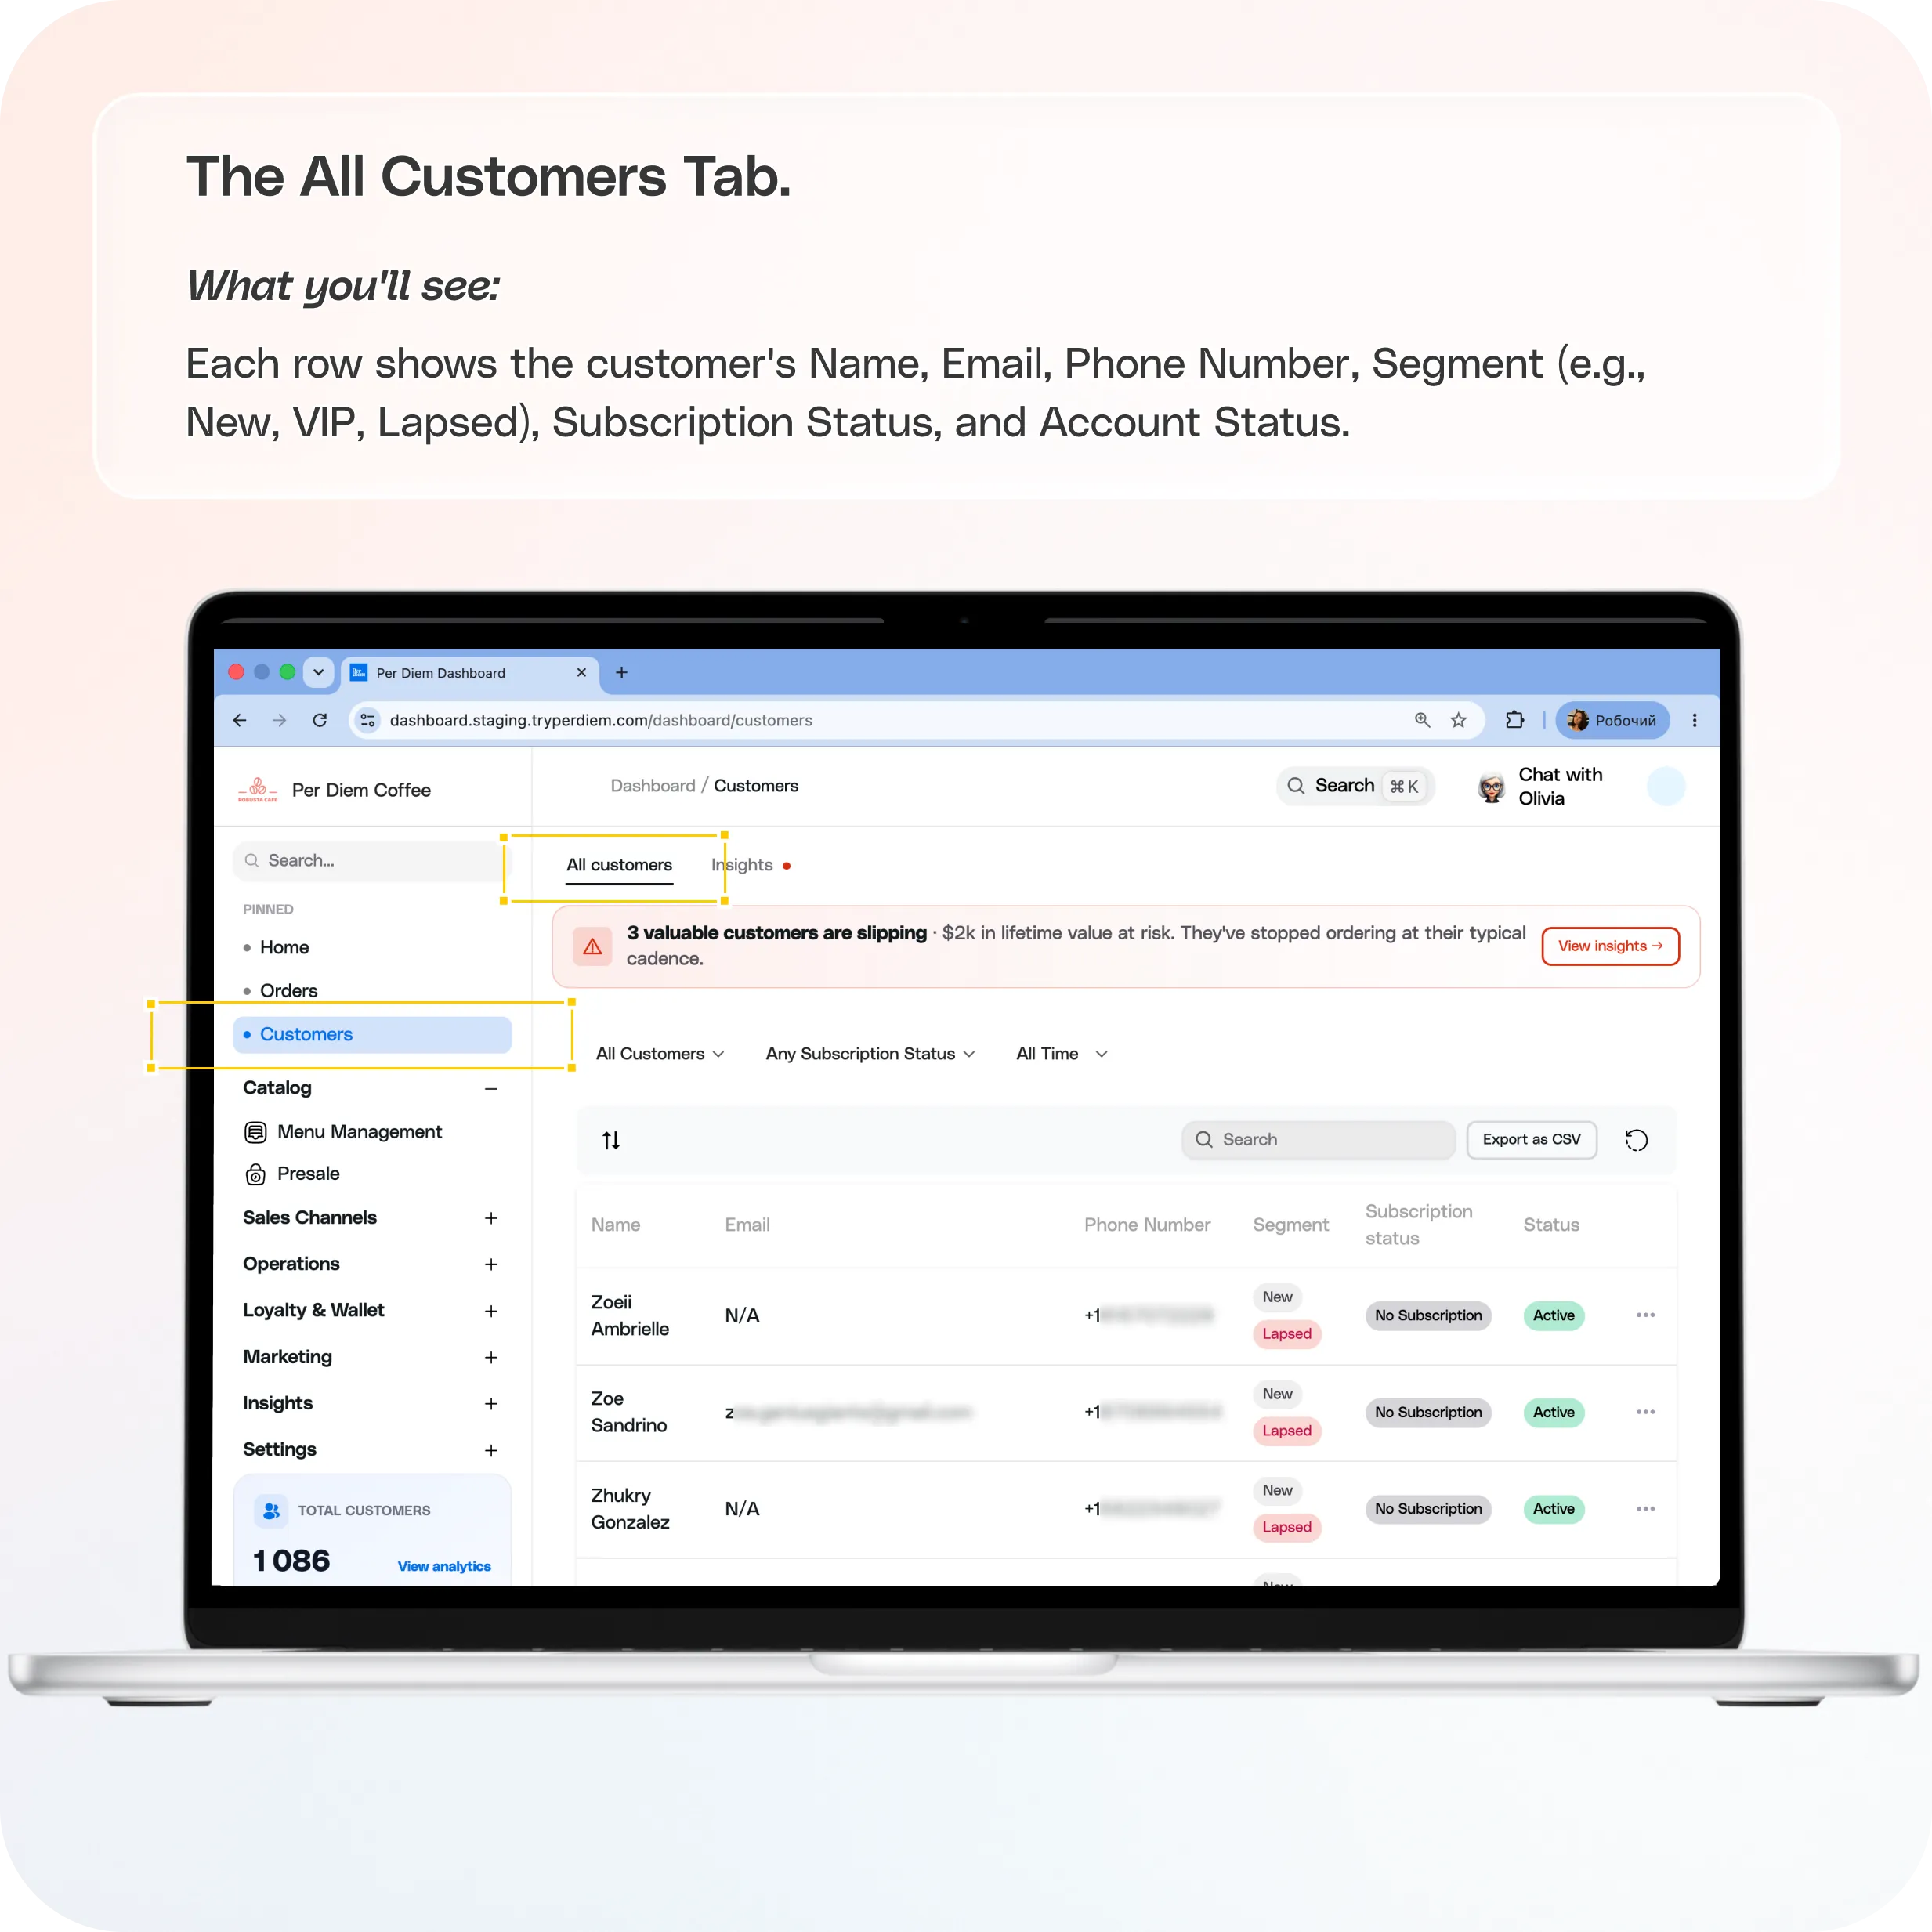
Accessing the CRM
- Log in to your Dashboard.
- In the left sidebar, click Customers.
- You'll land on the Customers page, which has two tabs at the top: All customers and Insights.
You can also see your total customer count (broken down by iOS and Android app users) at the bottom of the sidebar at all times.
The All Customers Tab
This is your customer directory: every customer in one searchable, filterable table.
What you'll see
Each row shows the customer's Name, Email, Phone Number, Segment (e.g., New, VIP, Lapsed), Subscription Status, and Account Status.
If valuable customers are slipping away, an alert banner appears at the top of the tab (e.g., "3 valuable customers are slipping · $2k in lifetime value at risk") with a View insights button that takes you straight to the Insights tab.
Filtering and searching
- Account status filter: All Customers, Active, Deactivated, or Deleted.
- Subscription status filter: Any, Active Subscription, Canceled Subscription, or No Subscription.
- Date filter: All Time, Today, Yesterday, This Week, Last Week, This Month, Last Month, This Year, Last Year, or a Custom date range.
- Search bar: find any customer by name, email, or phone number.
- Sort: use the sort icon above the table to reorder the list.
- Export as CSV: download your customer list for use in email tools, spreadsheets, or ad platforms.
Customer actions
Click the ⋯ menu at the end of any row to:
- View customer: open their full profile.
- AI Customer Analysis: jump straight to their AI-powered analytics page.
- View orders: see their complete order history.
- Streak history: view their ordering streaks.
- Update customer: edit their details.
- Send notification: send them a push notification.
- Add store credit: apply credit to their wallet.
- Adjust points: add or remove loyalty points.
- Block account / Delete account: restrict or remove the customer.
- Clear customer's birthday: remove stored birthday data.
The Insights Tab
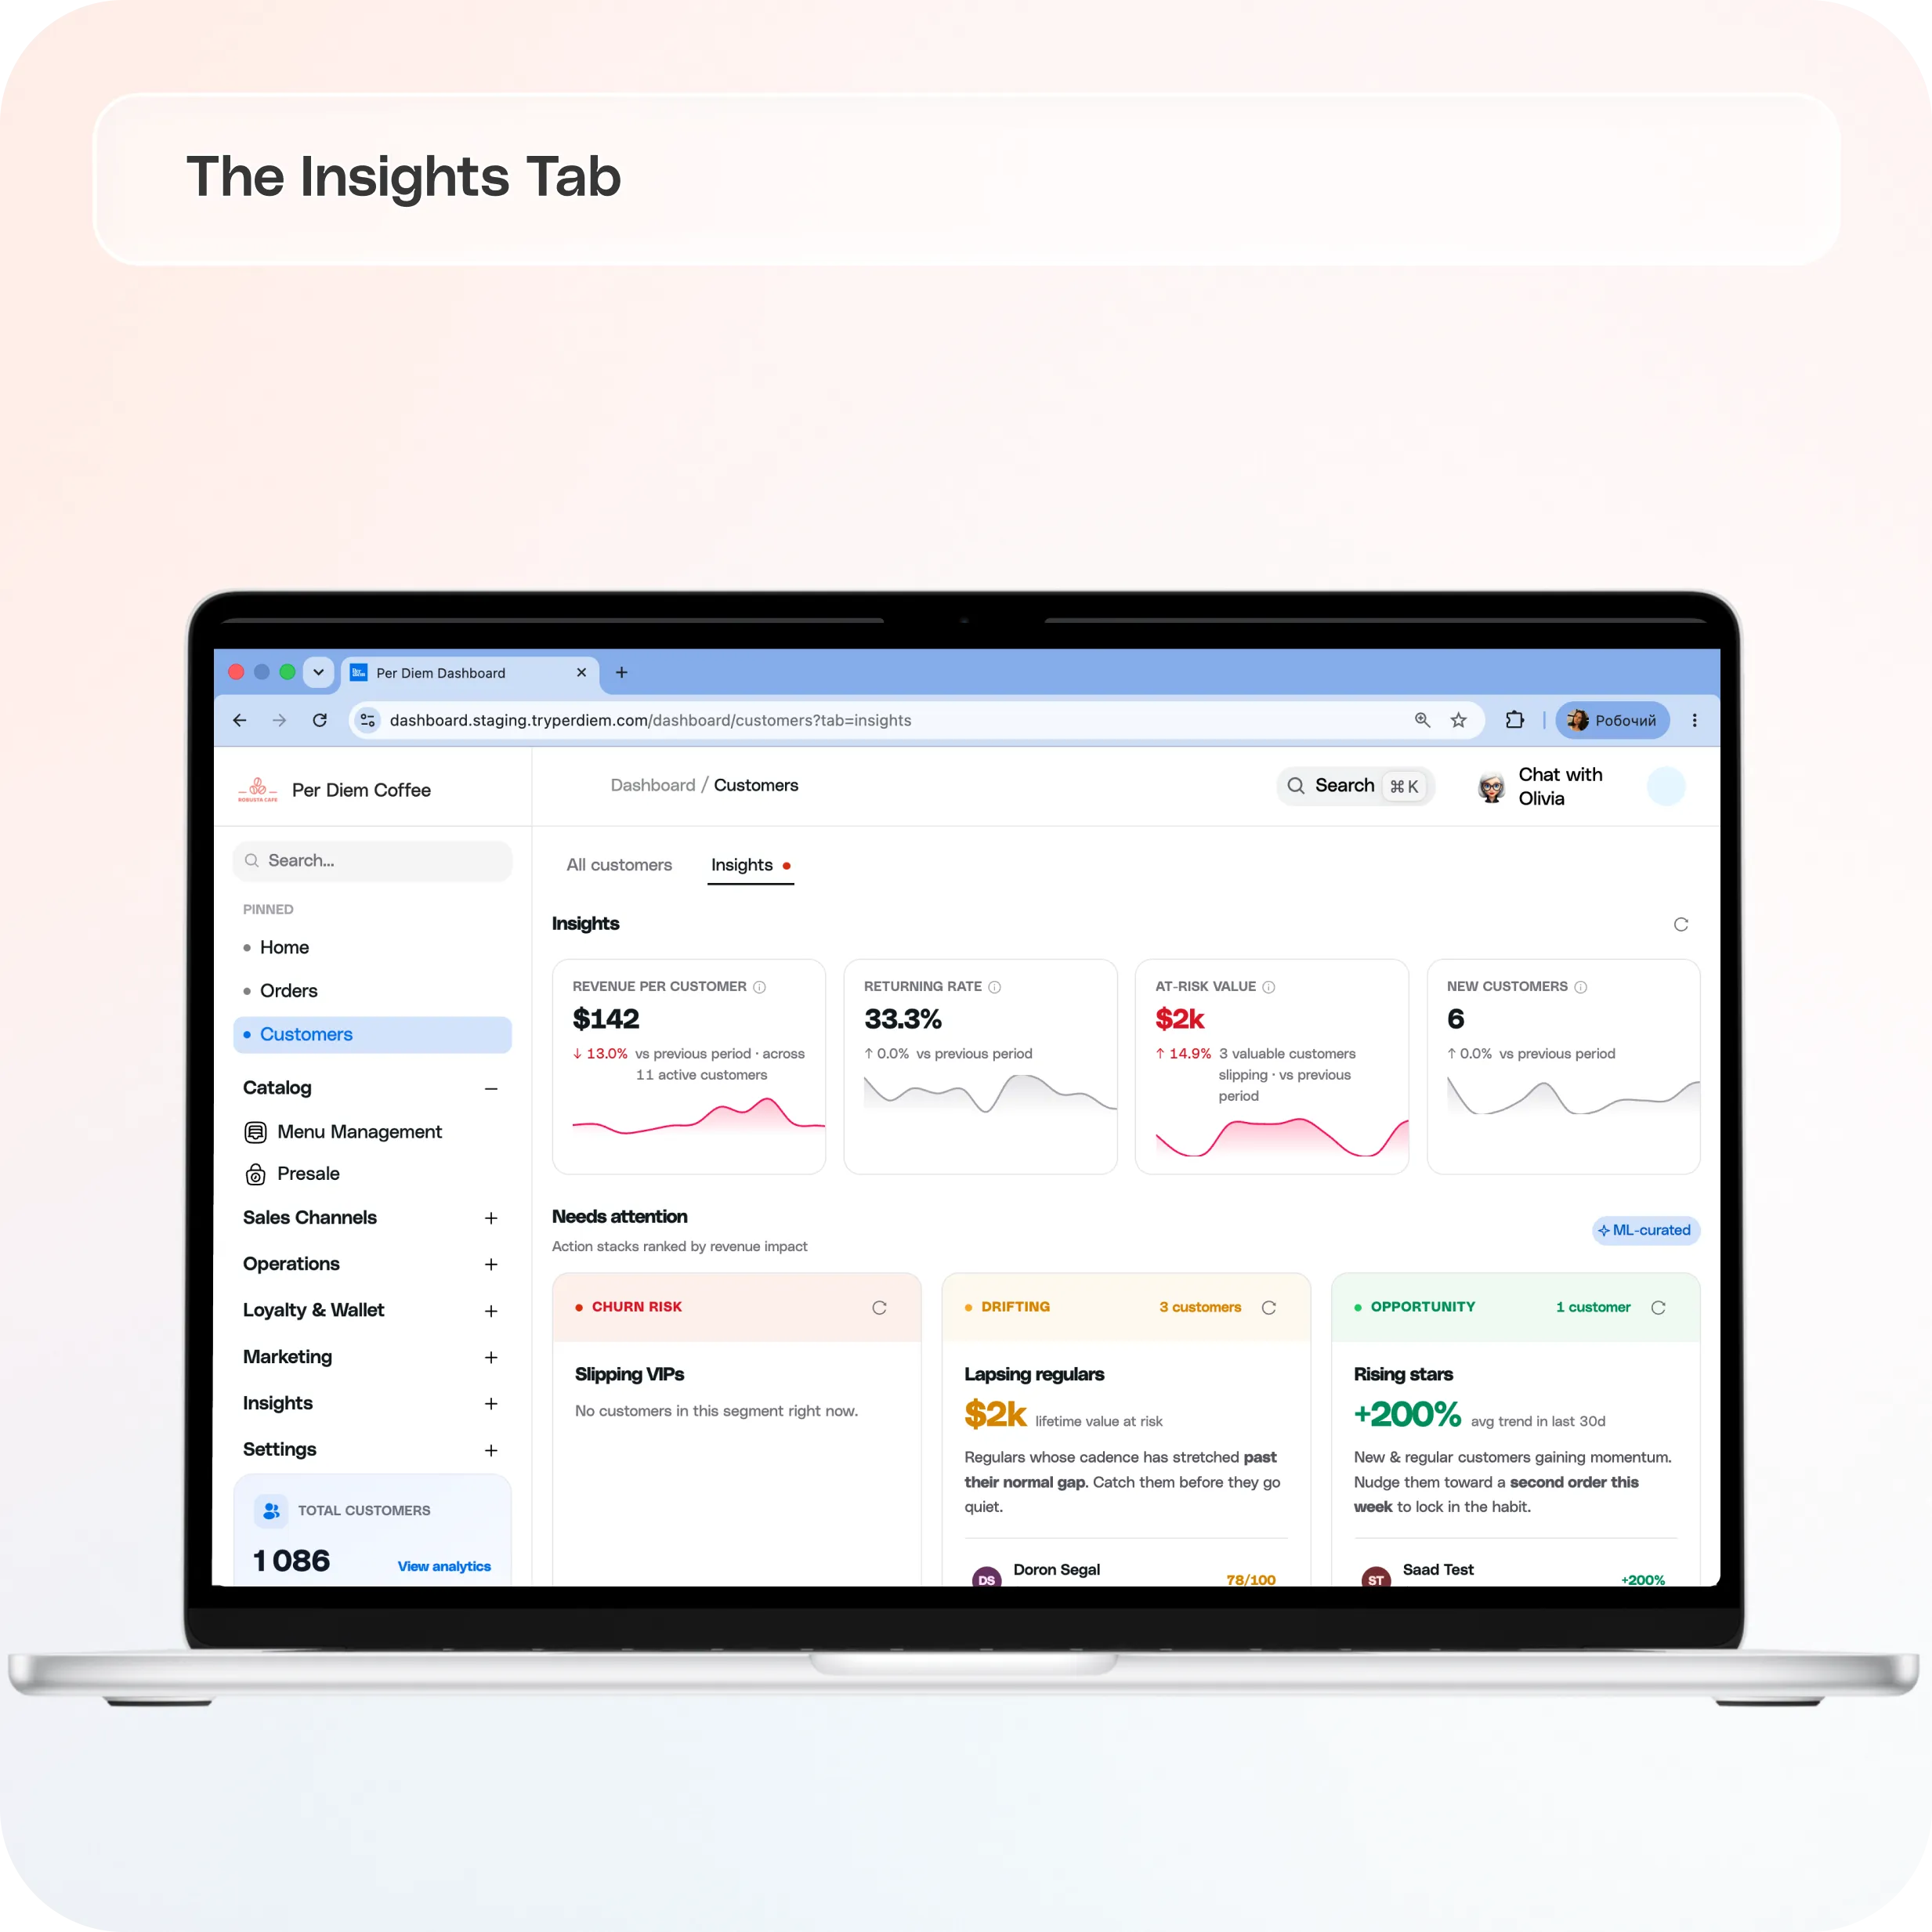
The Insights tab is your macro view: analytics across your entire customer base, refreshed automatically.
Key metrics (top cards)
- Revenue per Customer: average revenue per active customer, with trend vs. the previous period.
- Returning Rate: the percentage of customers who come back and order again.
- At-Risk Value: the total lifetime value of valuable customers who are slipping away.
- New Customers: how many new customers you gained vs. the previous period.
Needs Attention
This section is ML-curated: it groups customers into action stacks ranked by revenue impact, so you always know who to reach out to first.
- Churn Risk ("Slipping VIPs"): high-value customers who have gone quiet. Use the Send win-back offer button to reach them before they're gone.
- Drifting ("Lapsing regulars"): regulars whose ordering cadence has stretched past their normal gap. Each customer shows their lifetime value, days since last order, and a risk score out of 100. Use Run reactivation to bring them back.
- Opportunity ("Rising stars"): new and regular customers gaining momentum. Use Promote to loyalty to nudge them toward a second order and lock in the habit.
Customer Health Map
A scatter plot of your entire customer base. Each dot is a customer. The vertical axis is lifetime value and the horizontal axis is days since their last order. The map is divided into four zones:
- Healthy · High Value: recent, high-spending customers.
- Active · Low Value: recent but lower-spend customers.
- Slipping · High Value: valuable customers past the 30-day at-risk line. These deserve immediate attention.
- Churned · Low Value: customers who have gone quiet.
Dots are color-coded by segment: VIP, Regular, New, Lapsing, and Lapsed.
Segment Breakdown
A distribution bar showing how your customer base splits across the five segments (VIP, Regular, New, Lapsing, and Lapsed) with counts and percentage of base for each.
Individual Customer Profiles (AI Customer Analysis)
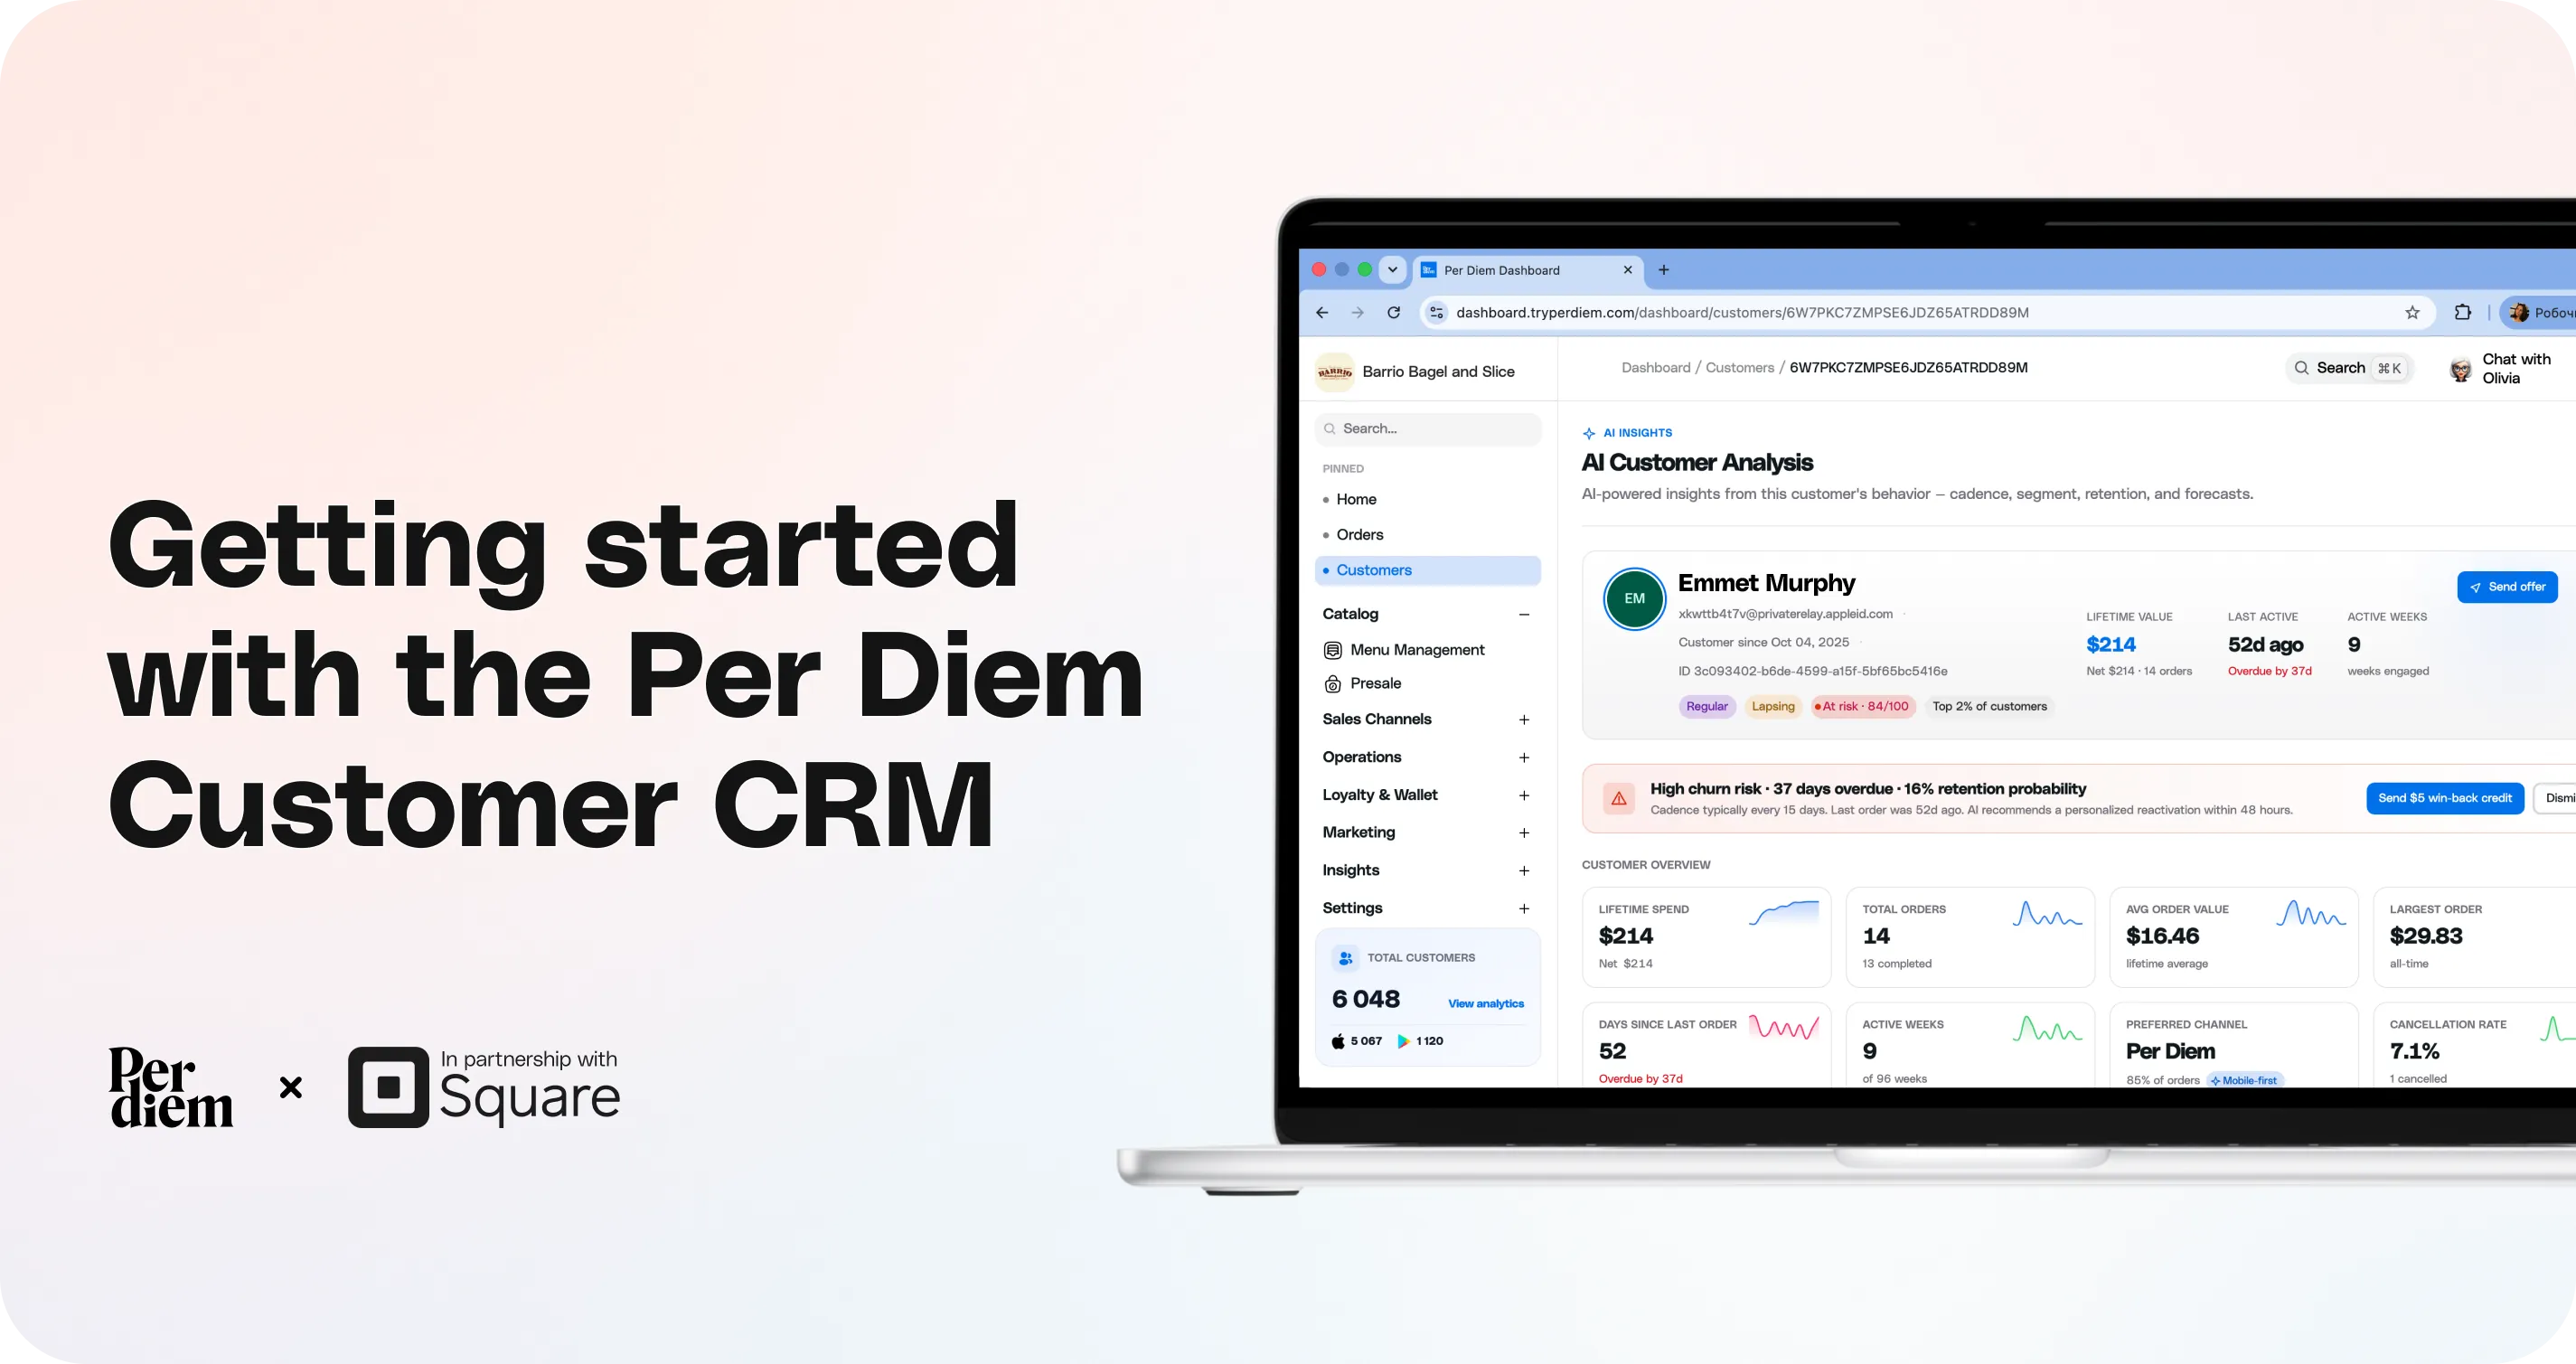
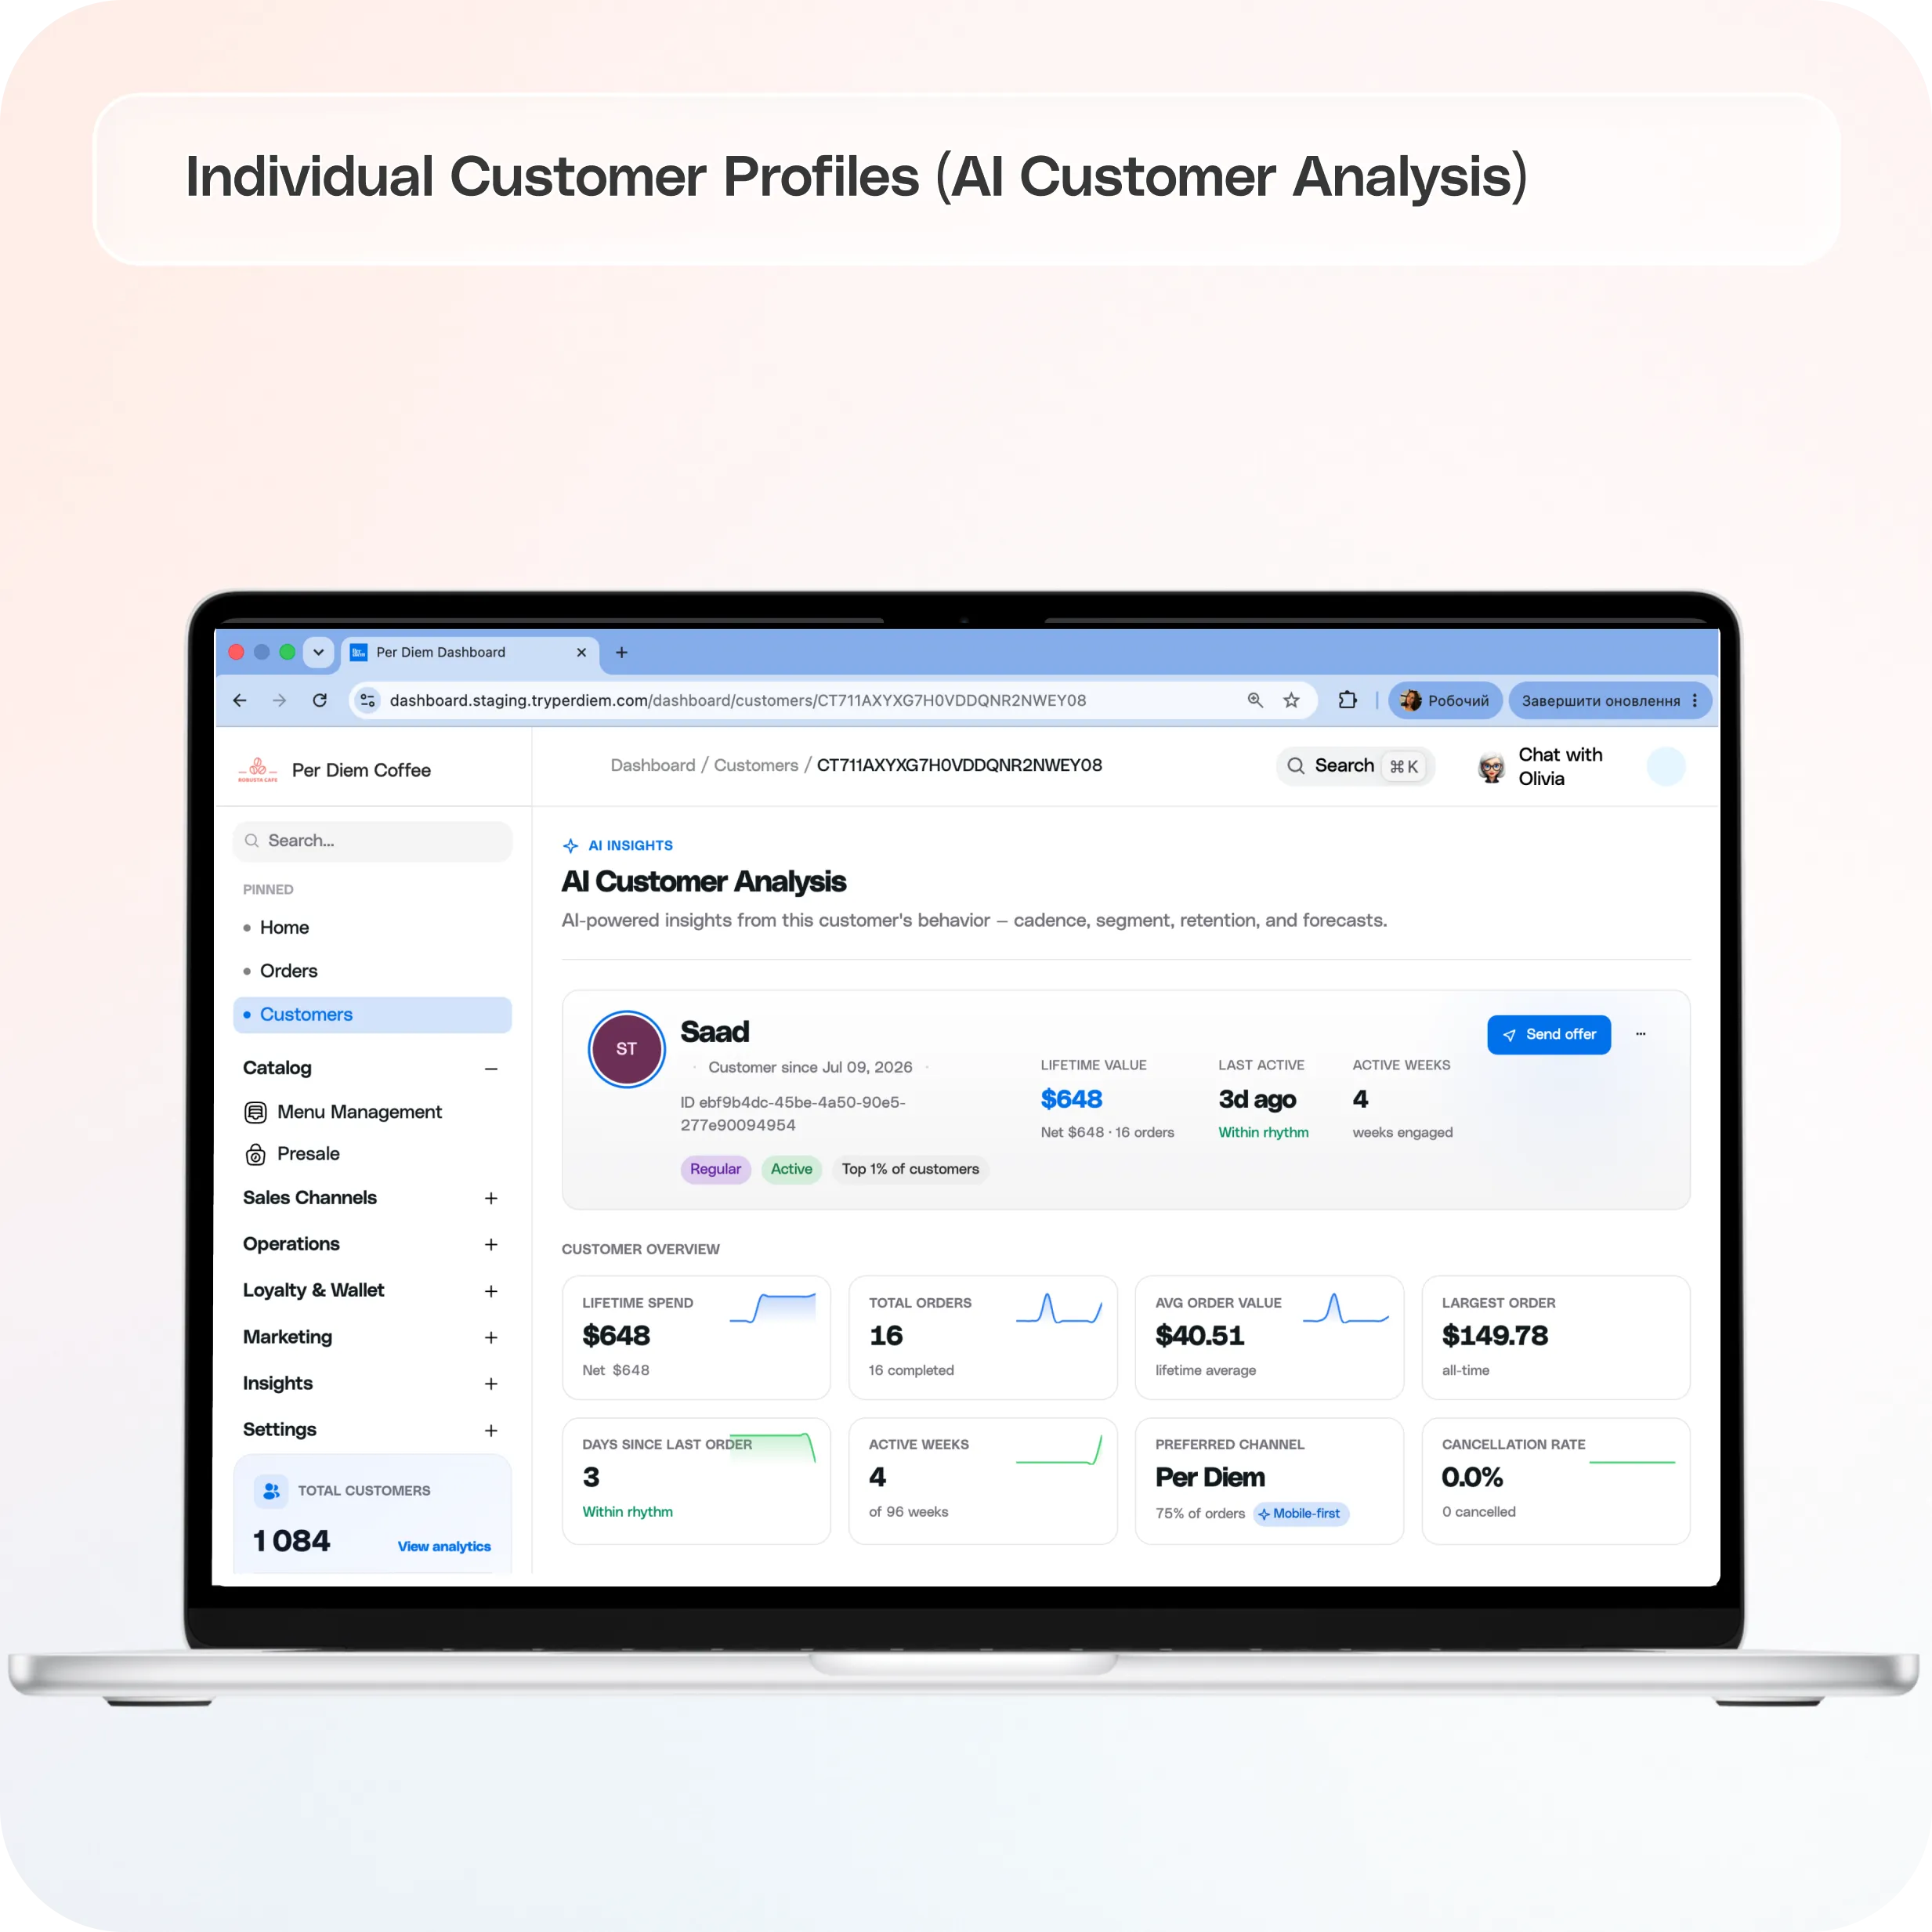
Open any customer (click their row, or choose AI Customer Analysis from the ⋯ menu) to see AI-powered insights into their behavior: cadence, segment, retention, and forecasts.
Profile header
Name, email, customer since date, segment badges (e.g., VIP, Lapsed, Top 1% of customers), lifetime value, last active date (with how overdue they are), and active weeks. A Send offer button lets you act right from the header.
AI recommendation banner
When action is warranted, a recommendation appears at the top. For example, a recently lapsed VIP prompt explains that win-back conversion drops sharply after ~6 months of dormancy, with a one-click Send re-engagement offer button.
Customer Overview
At-a-glance cards: Lifetime Spend, Total Orders, Average Order Value, Largest Order, Days Since Last Order, Active Weeks, Preferred Channel (app/web vs. walk-in), and Cancellation Rate.
Cadence & Forecasting
A predictive model of the customer's ordering rhythm, refreshed daily:
- Next order prediction: a plain-language answer to "when will this customer order again?", based on their last 90 days (e.g., "Isabella is 17 days late. Last order Jun 30 · usually every 1–5 days").
- Typical rhythm: their normal ordering interval and median gap.
- Behavior shifts: flags when their order rate slows vs. their expected pace.
- Churn risk score: 0–100, updated daily, with a risk level (e.g., 87 · High Risk).
- Loyalty profile (RFM): a 0–100 score built on recency, frequency, monetary value, tenure, and consistency.
- Retention probability: the likelihood this customer stays.
- Predicted next 90 days: projected spend and orders if you reactivate them vs. $0 if they churn, so you can see exactly what's at stake.
Monthly History & Seasonality
Spend and orders over the last 12 months, trailing totals, cohort, and seasonality patterns (e.g., "spend peaks in March, dips in August").
Channel Breakdown
Orders and revenue split between the Per Diem app/web and other channels (walk-in / POS), so you can see how digital-first each customer is.
Locations
For multi-location businesses: which locations the customer visits, their primary location, and visits and spend per location.
How to Get the Most Out of the CRM
Check "Needs Attention" regularly. It's ranked by revenue impact, so the customers at the top are the ones worth acting on today. A win-back offer sent while a VIP is recently lapsed converts far better than one sent months later.
Act from where you see the insight. Every insight comes with a built-in action: Send win-back offer, Run reactivation, Promote to loyalty, Send notification, Add store credit. You never need to leave the CRM to act on what you learn.
Use the Health Map to spot risk early. Anyone drifting into the "Slipping · High Value" zone is a retention opportunity you can still save.
Use profiles before reaching out. A customer's cadence, preferred channel, and favorite location tell you when, where, and how to reach them.
Reward your rising stars. The Opportunity stack surfaces customers building a habit. A well-timed loyalty nudge turns a new customer into a regular.
Export and segment. Filter your list (e.g., Lapsed customers with no subscription) and export to CSV to power campaigns in other tools.
Still have questions?Contact us
Ask anything or just say hi